
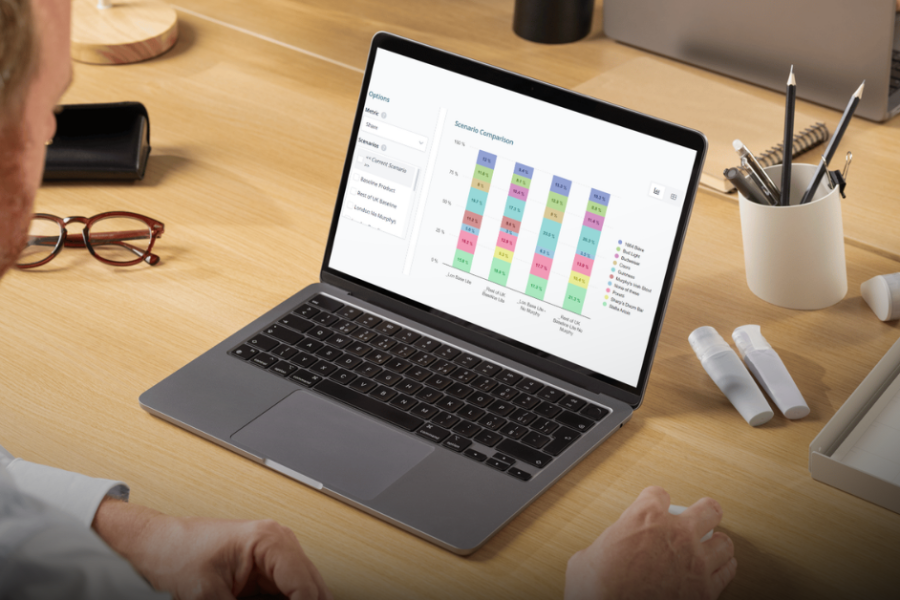
With two new reporting features – Scenario Comparisons and Source Gains – we wanted to help you get even more clarity to identify what is driving your performance when product, pricing and merchandising changes are made.
Scenarios Comparisons
We have created a new scenario comparison charting feature to allow you to easily see the impact of changing product features, prices or range.
Now you can understand quickly which scenarios minimize shoppers rejecting the category, find the scenario that best delivers volume share leadership, and the strategy that best maximizes the revenue for your brands or the category as a whole.
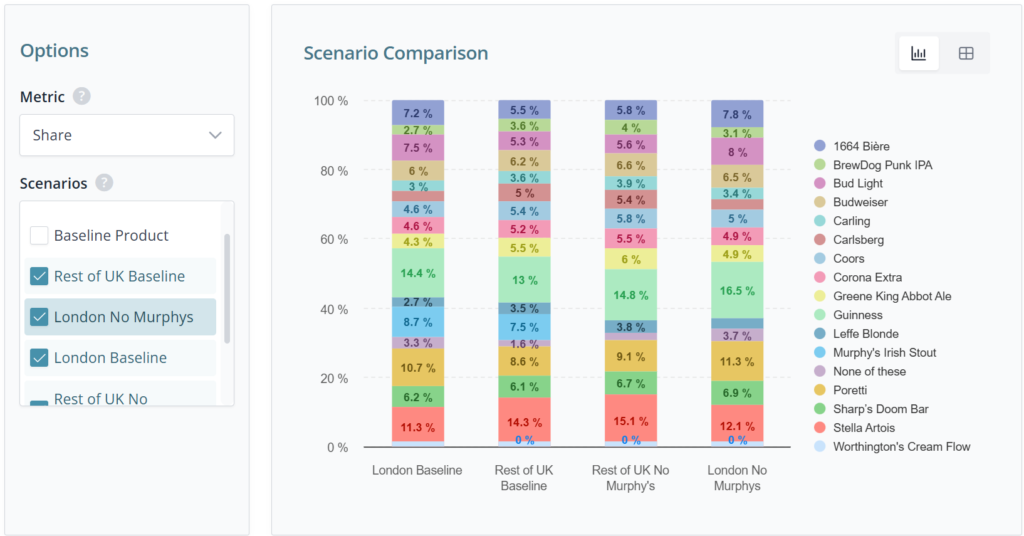
This means you will be able to quickly get decision-making information for several scenarios.
When simulating price increases for yours or competitor’s product(s), you will be able to see how price changes impact volume shares.
When launching an innovation, you will see what market share impact your innovation (including PPA changes) will have on your brand and the category in volume and value.
When delisting you will understand what replacing certain SKUs will do to volume and value share, as well as absolute volume and value. Do more shoppers exit the category or will they be absorbed by the remaining SKUs.
For new promotional mechanics, you will understand if promotions increase volume, value and bring new shoppers into the category or are they just subsidizing your base.
Source Gains
Conjoint studies track the choices made by individuals in a controlled shopping environment. If prices change then shoppers will change their selections as value perception changes.
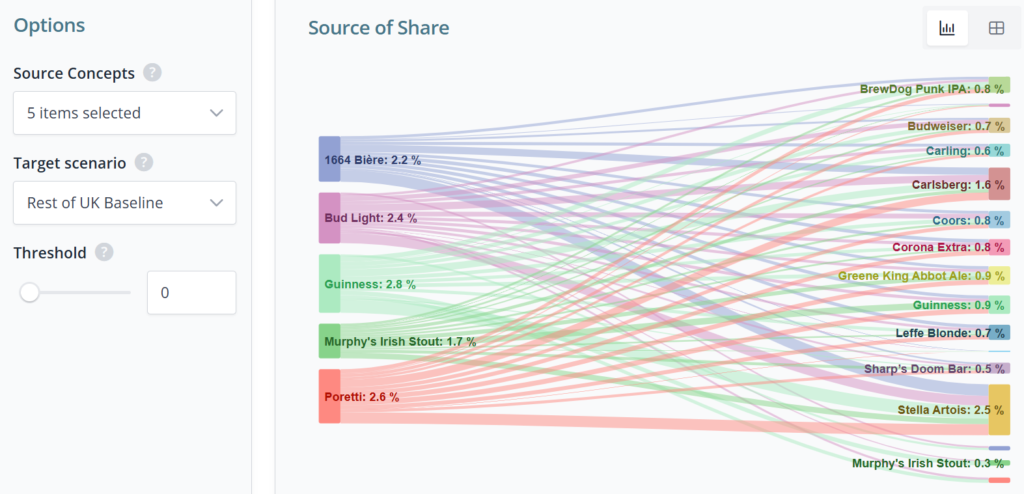
Now EPIC can help you see exactly where shoppers have been gained from or lost to. This is the next level down in granularity to enable you to quantify the impact of cannibalization and margin leakage.
With the ability to filter by shopper groups, you can also identify which shopper groups (age, geo, socio, brand loyalty, category usage) changed their buying behavior.
What does this mean for pricing?
When simulating price increases for yours or competitor’s product(s), you can now see what substitute products benefit when the prices are changed.
When launching an innovation, you can now see which shoppers were affected by the innovation, and how it influenced trade up and new category penetration.
When recommending a delist it requires some convincing data to prove that shoppers and category sales will not be lost. Now you can identify the exact shoppers that were rescued by the remaining range, and which products benefit the most.
With promotional mechanics, previously you could see the net impact from testing promotions in conjoint surveys. Now you can see what promotional mechanic is ideal for stealing from your competitor and use surgical precision to select the promotion that best wins new shoppers or drives basket size increases.
See New Reporting in Action
Ready to see how these new reporting features can transform your strategy? Don’t just read about the upgrade – experience it. Get in touch with our team today to book a personalized demo and see Scenario Comparisons and Source Gains in action using insights tailored to your business.